Bollinger Bands

Bollinger Bands plot a moving average with upper and lower bands based on standard deviation, framing volatility and stretch around price.

What Is Bollinger Bands?

Bollinger Bands plot a moving average with upper and lower bands based on standard deviation, framing volatility and stretch around price.

Bands widen when volatility rises and contract when it falls. Band touches are context, not automatic reversals.
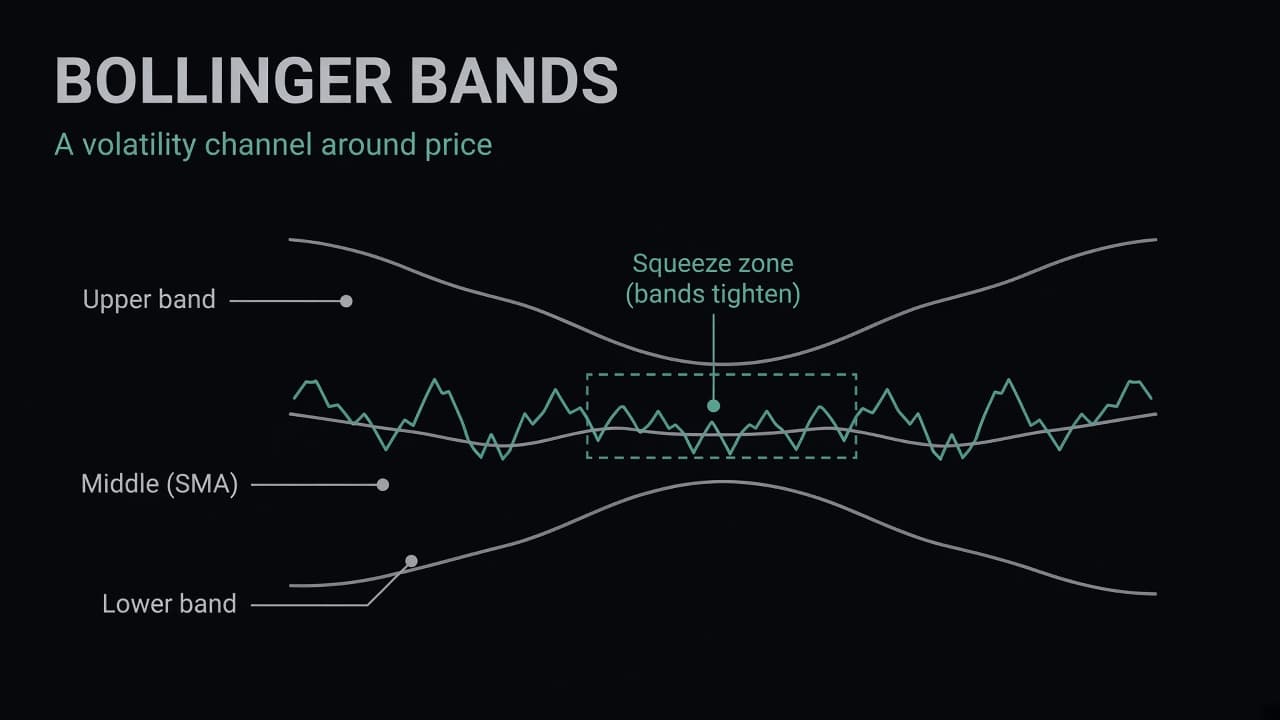

Bollinger Bands diagram with upper band, middle SMA, lower band, and a squeeze
Bollinger Bands — a volatility channel around a middle average, tighter in a squeeze.

Why Bollinger Bands Matters

  • Why traders care: Volatility envelope for stretch vs a typical range.
  • Playbook fit: Best with structure, volume, and risk rules.
  • Alert fit: Clear levels or thresholds become Phalerta notifications.

How Traders Use Bollinger Bands

Common settings use a 20-period mid line with bands at two standard deviations. Combine with volume or RSI.

Example: Bollinger Bands in Practice

A trader alerts when price closes outside the upper band on the 1h after a squeeze.

Pro Tip

Alert on band breaks you care about — not every touch.

Background of cta
Phalerta Logo

Never Miss a Market Move Again

Turn Bollinger Bands context into action. Set custom crypto alerts in Phalerta and get real-time notifications on Telegram, Discord, Email, or the app.

Frequently asked questions

What is Bollinger Bands?

Bollinger Bands plot a moving average with upper and lower bands based on standard deviation, framing volatility and stretch around price.

Do band touches mean reverse?

Not always. Trends can walk the band.

Can Phalerta help?

Yes — set price or indicator alerts and get notified on Telegram, Discord, Email, or the app.

Precision Alerts, Confident Trading.