Wick
A wick (or shadow) is the thin line on a candlestick showing prices traded beyond the open-close body, marking the period’s high or low extreme.
A candlestick is a chart unit that shows open, high, low, and close for a period, with the body marking open-to-close and wicks marking extremes.
A candlestick is a chart unit that shows open, high, low, and close for a period, with the body marking open-to-close and wicks marking extremes.
Candles are building blocks of crypto charts and many pattern playbooks. Timeframe choice changes what each candle represents.
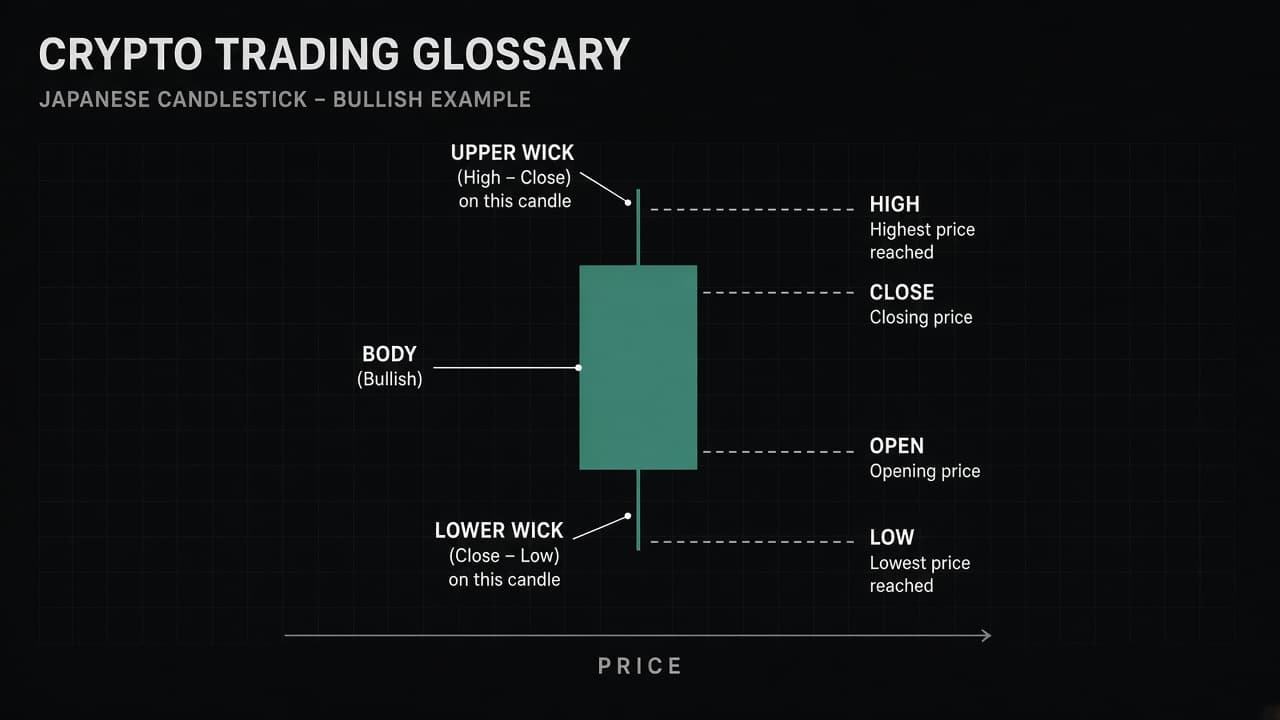
Green/up candles close above open; red/down close below (colors can vary). Read body size, wick length, and location vs structure.
A trader studies a daily bullish engulfing at support, then sets a price alert above the candle high.
Alert on levels created by important candles.
A wick (or shadow) is the thin line on a candlestick showing prices traded beyond the open-close body, marking the period’s high or low extreme.
A doji is a candlestick where open and close are nearly equal, producing a tiny body that can signal indecision after a directional move.
A hammer is a candlestick with a small body near the high and a long lower wick, often watched as potential bullish rejection after a decline.


Turn Candlestick context into action. Set custom crypto alerts in Phalerta and get real-time notifications on Telegram, Discord, Email, or the app.
A candlestick is a chart unit that shows open, high, low, and close for a period, with the body marking open-to-close and wicks marking extremes.
Open, high, low, and close for the selected interval.
Yes — set price or indicator alerts and get notified on Telegram, Discord, Email, or the app.