Divergence
Divergence is when price and an indicator (such as RSI or MACD) move in opposite directions, often used as a warning that momentum may be fading.
RSI (Relative Strength Index) is a momentum oscillator that measures how quickly prices have risen or fallen, typically on a 0–100 scale, to highlight overbought or oversold conditions.
RSI (Relative Strength Index) is a momentum oscillator that measures how quickly prices have risen or fallen, typically on a 0–100 scale, to highlight overbought or oversold conditions.
Traders use RSI for exhaustion, confirmation, and divergence — not as a guarantee. In crypto, RSI can stay extreme longer because markets trade 24/7.
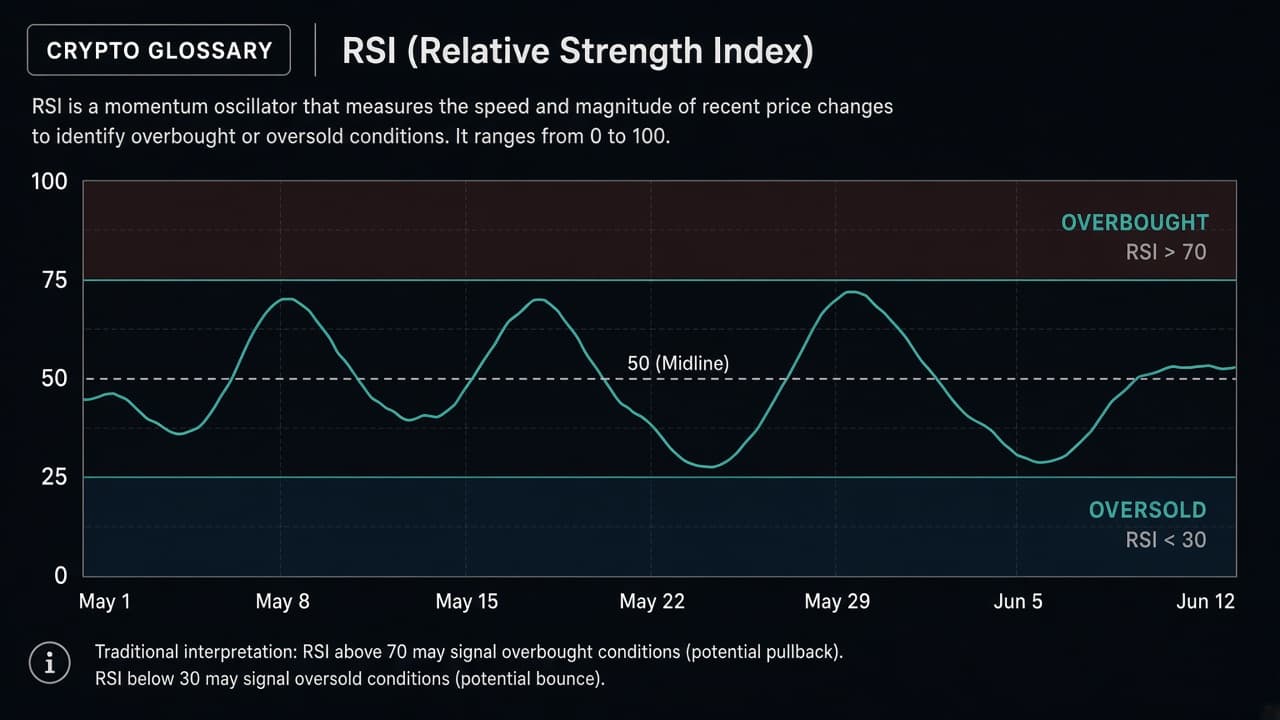
RSI plots beneath the chart. Common zones are above 70 (overbought) and below 30 (oversold), though crypto can sustain extremes.
A trader wants notice when BTC 1h RSI crosses back above 30 after an oversold dip, so they review the chart without staring at it.
Create an RSI indicator alert in Phalerta on the interval you trade; deliver via Telegram or mobile.
Divergence is when price and an indicator (such as RSI or MACD) move in opposite directions, often used as a warning that momentum may be fading.
Overbought describes a market condition where an oscillator (often RSI) prints in a high zone, suggesting strong recent buying pressure that may be stretched.
An indicator alert notifies you when a technical indicator condition you configure becomes true — for example an RSI threshold or MACD cross.


Turn RSI context into action. Set custom crypto alerts in Phalerta and get real-time notifications on Telegram, Discord, Email, or the app.
Relative Strength Index — a momentum oscillator, not one coin versus another.
No. Strong trends can keep RSI elevated. Use structure and risk rules.
Yes. Build indicator alerts and receive them on Telegram, Discord, Email, or the app.