Market Depth
Market depth describes how much volume is available at various bid and ask prices in the order book.
Volume refers to the total amount of an asset traded over a given period. It helps traders assess market strength, confirm trends, and detect momentum shifts in crypto.
Volume represents the total quantity of a cryptocurrency that has been bought and sold during a specific time period. It is one of the most important metrics in technical analysis, offering insights into the strength or weakness of a price move.
In crypto trading, volume is often shown as vertical bars on the bottom of candlestick charts. A high trading volume signals strong interest and activity, while low volume may indicate market indecision or lack of participation.
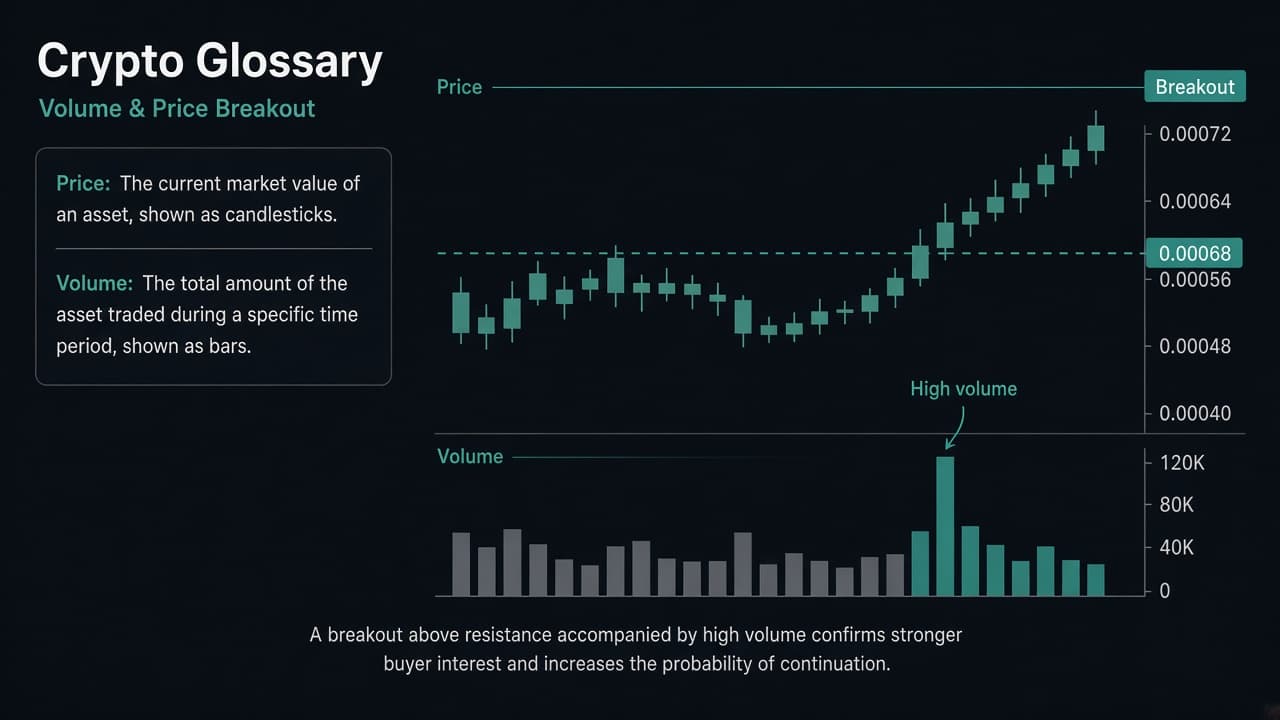
The most common metric. It reflects the total number of coins traded (buy and sell) in a given timeframe, such as 1h, 4h, or 1D.
Some platforms break down volume by trade direction:
Used more in blockchain analysis, it measures the amount of crypto moved on the blockchain — not just on exchanges.
Suppose BTC breaks above a key resistance at $30,000. If this move is accompanied by high volume, it suggests strong buyer interest and increases the likelihood of a successful breakout. If the breakout happens with low volume, it may be a false move or bull trap.
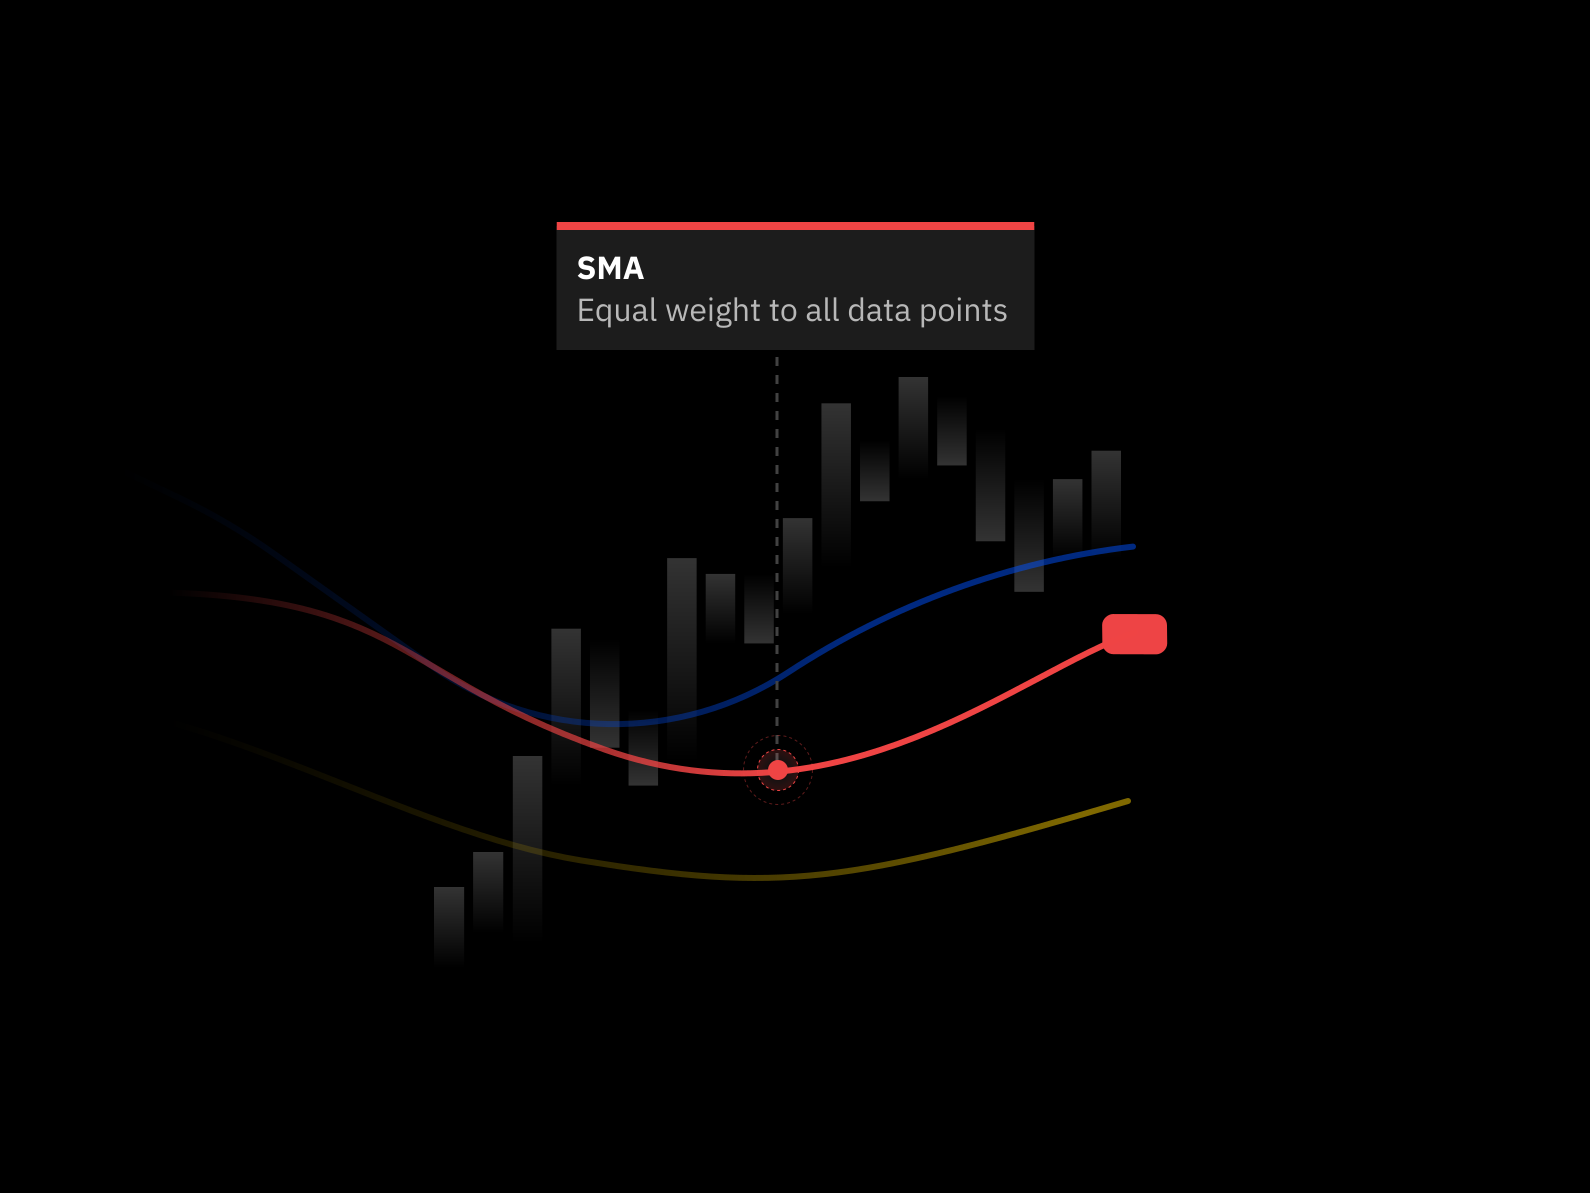
Pair volume with other indicators like RSI, MACD, or moving averages for stronger trade confirmations. For example, a bullish engulfing candle on high volume is more reliable than one on low volume.


Turn insights into action. Set up custom crypto alerts in Phalerta to track key indicators like ADX-DI and stay informed with real-time notifications. Simplify your trading strategy and never miss critical market signals again.
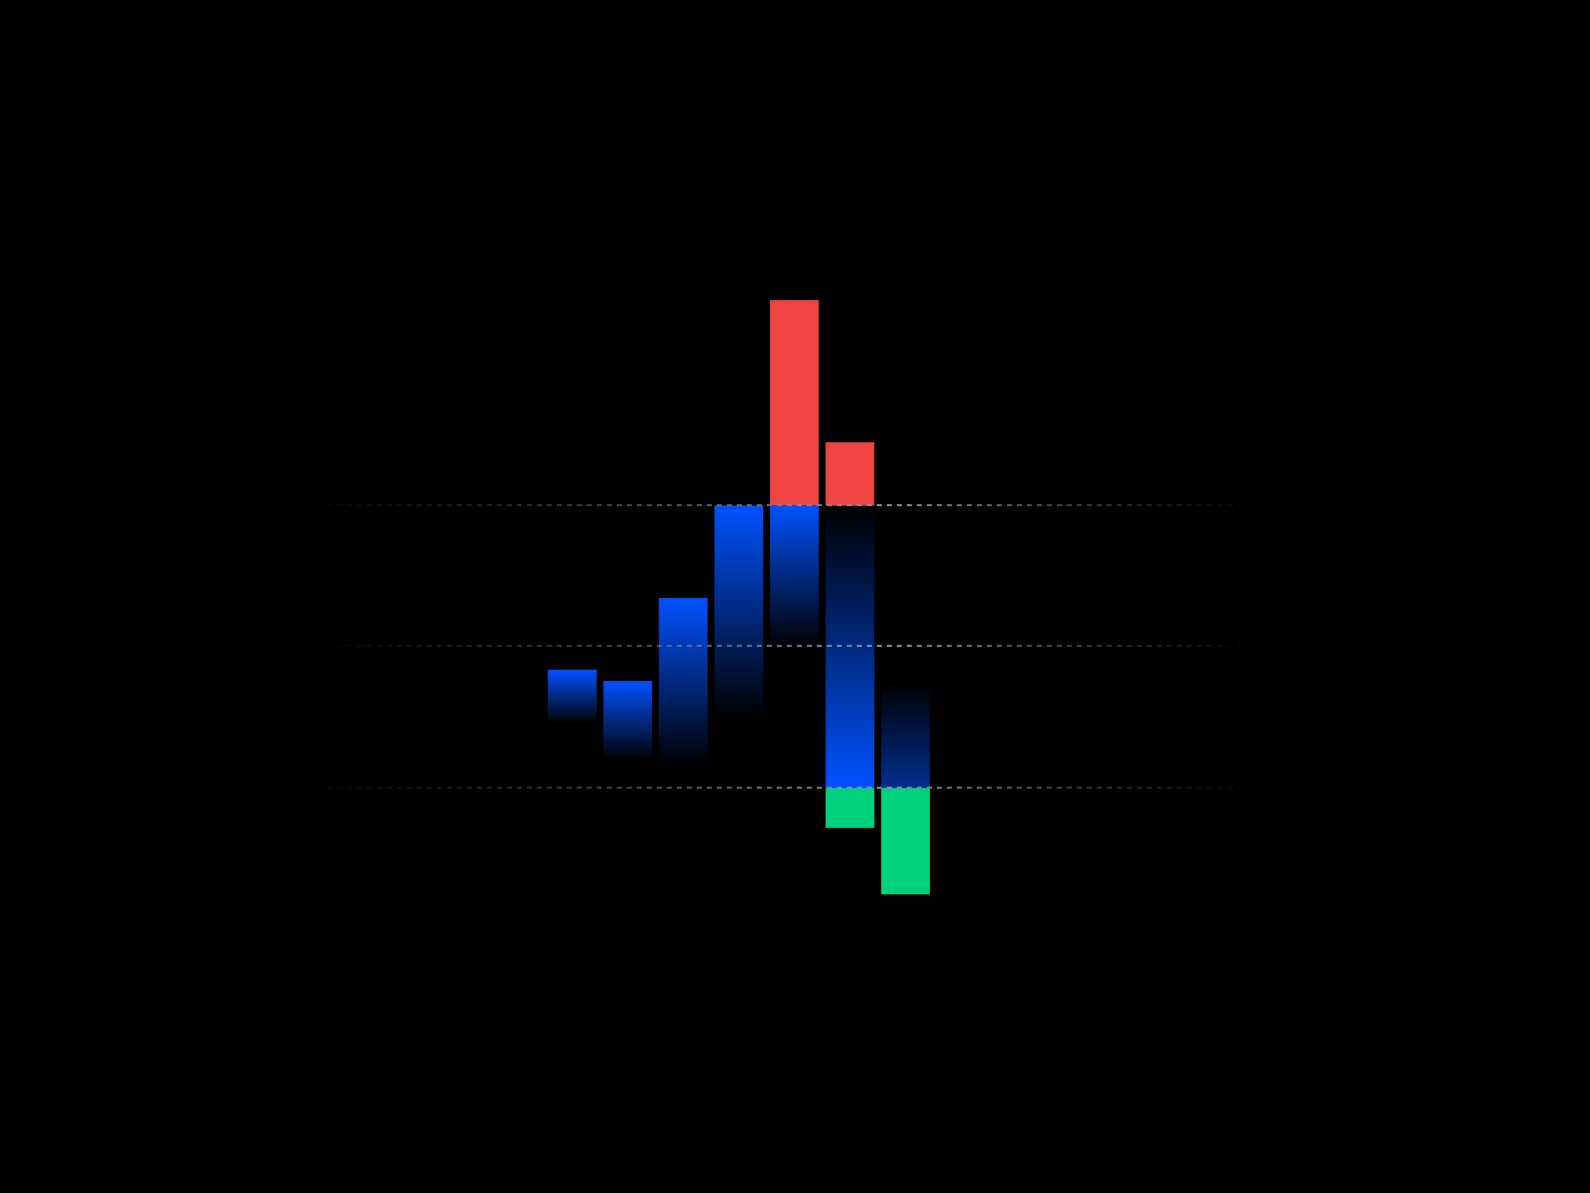
Volume shows how much of a cryptocurrency has been traded over a period. It helps measure market activity and sentiment.
Volume is shown as bars below the price candles. Taller bars indicate more trades. Compare volume bars to understand periods of high or low participation.
High volume supports the strength of a price movement and indicates strong trader interest. It can validate breakouts or trend continuation.
Yes. Price movements with low volume are less reliable. They may be driven by few participants and can reverse quickly.
Not exactly. Volume is about trading activity over time. Liquidity refers to how easily an asset can be bought or sold at a stable price. They are related but not identical.
You can set alerts on volume spikes, combine volume with other indicators like RSI or MACD, and monitor real-time volume movements on multiple coins and timeframes.
When price moves in one direction but volume moves in the opposite, it signals weakness in the trend. For example, rising price with falling volume may hint at a reversal.
Yes. Automated bots can generate artificial volume through frequent trades, especially in low-liquidity markets. Be cautious when analyzing volume in smaller tokens.