ATR
ATR (Average True Range) measures typical price range over a lookback period, helping traders gauge volatility for stops, targets, and alert buffers.
Volatility refers to the degree of price fluctuation in a crypto asset over a period. High volatility signals larger swings, while low volatility indicates stability.
Volatility measures how dramatically the price of a cryptocurrency moves within a set timeframe. In simple terms, it’s a way of describing how “jumpy” or “calm” an asset behaves on the market. When prices swing aggressively up and down, the asset is said to be highly volatile. If it moves slowly and steadily, it’s low in volatility.
Cryptocurrencies are known for being more volatile than traditional assets due to their relatively low market capitalization, limited regulation, and sensitivity to investor sentiment and global news.
Volatility plays a key role in:
| Tool | Description |
|---|---|
ATR (Average True Range) | Shows average price movement over a timeframe. |
Bollinger Bands | Uses standard deviation to display price extremes. |
Standard Deviation | A statistical measure of price dispersion. |
Historical Volatility (HV) | Tracks past price fluctuations. |
In 2020–2021, Bitcoin experienced a sharp rise from $10,000 to over $60,000, followed by steep corrections. This volatility created opportunities for active traders while increasing risk for unprepared investors.
In traditional finance, volatility is often measured by indices like the VIX (Volatility Index), which reflects expected market turbulence. While crypto doesn’t yet have a universally adopted equivalent, tools like BVOL (Bitcoin Volatility Index) provide similar insights.
Traders should use tools like stop-loss, position sizing, and alerts to manage these risks.
ATR (Average True Range) measures typical price range over a lookback period, helping traders gauge volatility for stops, targets, and alert buffers.
Bollinger Bands plot a moving average with upper and lower bands based on standard deviation, framing volatility and stretch around price.


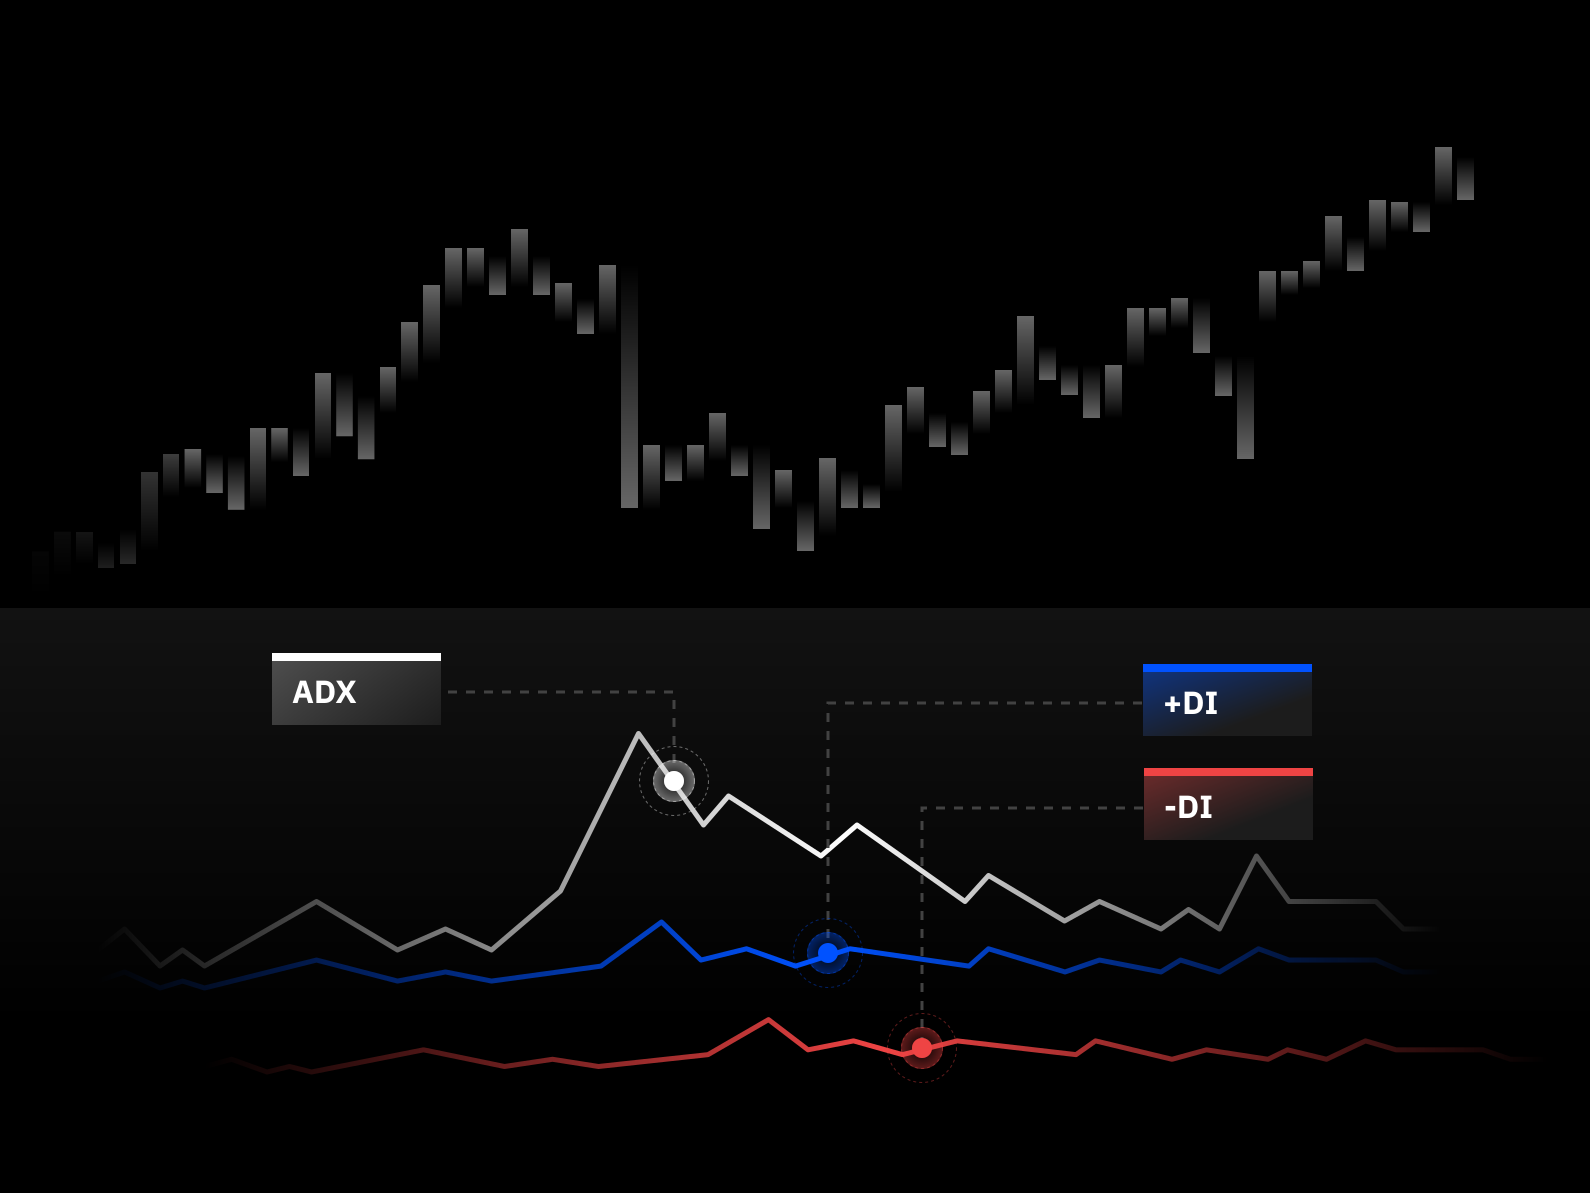
Turn insights into action. Set up custom crypto alerts in Phalerta to track key indicators like ADX-DI and stay informed with real-time notifications. Simplify your trading strategy and never miss critical market signals again.
Because of its lower market size, high speculation, and lack of centralized regulation.
It depends on your trading style. Scalpers love it. Long-term investors may avoid it.
ATR, Bollinger Bands expansion, and large candle wicks are good signs.
Not perfectly. However, low-volatility periods often precede breakouts.
It’s when the bands contract, suggesting a period of low volatility, often followed by a sharp move.
Sudden events, like regulatory crackdowns or exchange failures—can spike volatility within minutes.
Generally no, as they are pegged to fiat currencies. But extreme market stress can still affect them.
Higher volatility increases risk; smart traders adjust their position size accordingly.
They monitor volatility to decide entry/exit points, and set tighter or looser stops.
It may reduce risk, but also limits profit potential. Depends on your goals.